Key Highlights
WTI Crude Oil prices have initiated a new upward movement, surpassing the $71.50 resistance level.
A bullish trend line is emerging, providing support at $71.20 on the 4-hour chart.
Gold prices may rise further if they break above the $2,650 mark.
The EUR/USD pair needs to exceed 1.0420 to initiate a significant recovery trend.
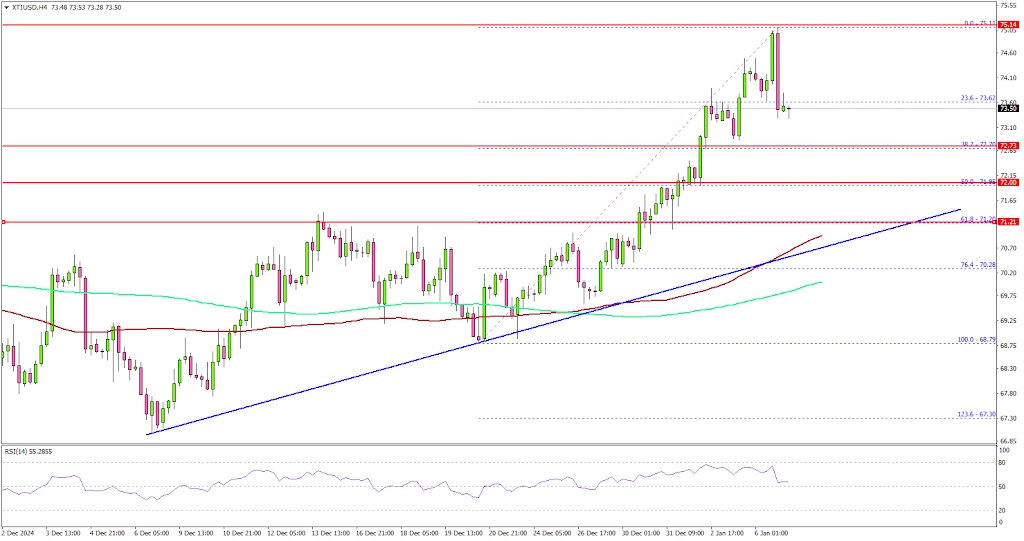
WTI Crude Oil Price Technical Analysis
WTI Crude Oil prices found a foothold around the $68.80 area, establishing a base before beginning a new ascent above $70.00.
Analyzing the 4-hour chart for XTI/USD, the price has gained momentum, moving past the $71.50 resistance level, as well as the 100 simple moving average (red, 4-hour) and the 200 simple moving average (green, 4-hour).
The bullish momentum has even driven prices above the $74.00 mark, reaching a peak of $75.11, with the price now consolidating its gains. A slight pullback occurred below the 23.6% Fibonacci retracement level of the upward movement from the $68.79 swing low to the $75.11 high.
Additionally, a bullish trend line is forming with support at $71.20 on the same chart, which aligns closely with the 61.8% Fibonacci retracement level of the upward movement from the $68.79 swing low to the $75.11 high.
On the upside, the price encounters resistance near the $74.20 level, with the primary obstacle remaining around the $75.00 zone. A breakthrough here could lead to further upward momentum.
In such a scenario, the price might even approach the $76.50 resistance level. Continued gains could potentially test the $78.00 resistance zone in the near future. Conversely, the first significant support level is located around the $72.70 area.
A daily close below $72.70 could pave the way for a more substantial decline, with the next major support at $71.20. Additional losses could drive oil prices toward the $70.00 mark in the upcoming days.
Regarding Gold, there has been a consistent rise above the $2,620 level, and bulls may now target a move above $2,650.